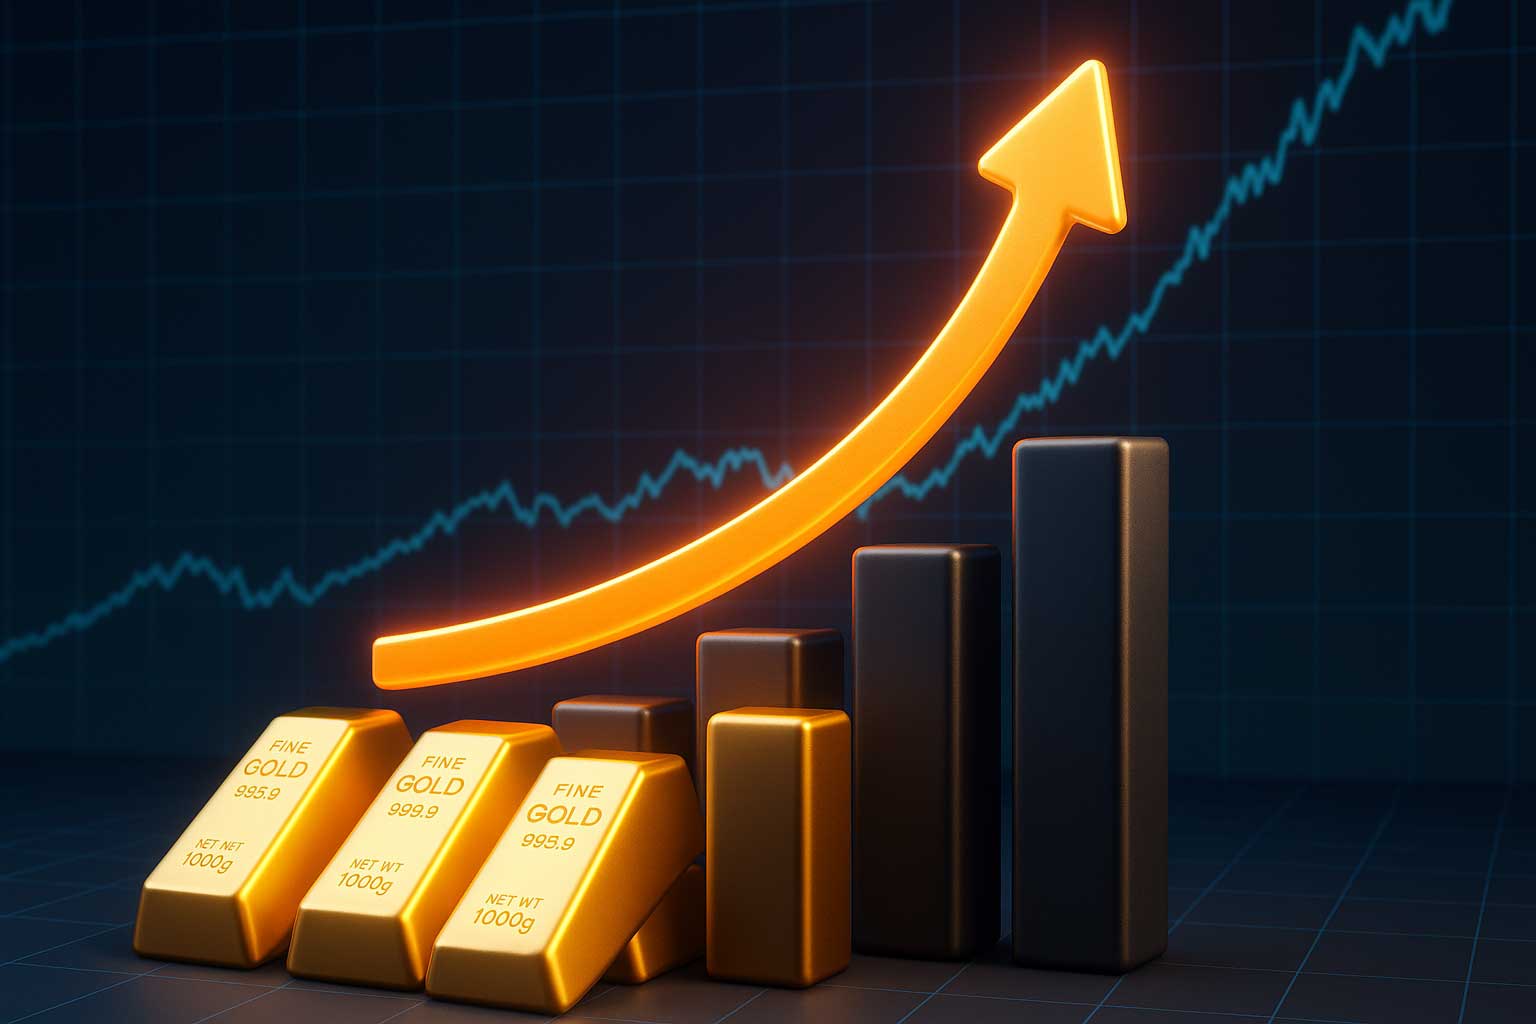
Gold prices could see remarkable growth over the next 5 years. The precious metal reached $4,014 – a historic milestone that represents a 50% increase year-to-date. The market shows incredible strength with a 51% climb this year. Strong central bank buying and higher demand for gold-backed ETFs have stimulated this growth.
Goldman Sachs projects an ambitious target of $4,900 per ounce by December 2026. Other analysts expect gold to hit $4,200 by 2026, with prices potentially reaching $5,155 by 2030. Goldman Sachs Research suggests a steady 6% rise through mid-2026. Central banks’ purchases should average 80 metric tons in 2025 and 70 tons in 2026. Emerging market central banks have stepped up their gold purchases by nearly five times since 2022. Investors who want to tap into this upward trend can turn to Bitgolder – the best platform to buy gold and silver using Bitcoin and over 100 other cryptocurrencies.
This piece will get into institutional forecasts and assess the macroeconomic factors behind the $4,500 target. We’ll look at technical indicators that support the bullish outlook and show you how to position yourself to benefit from gold’s expected growth through 2026 and beyond.
Institutional Forecasts for 2026 and Beyond

Image Source: GoldBroker.com
Major financial institutions have revised their gold price predictions for the next 5 years recently, showing growing confidence in the precious metal’s upward trajectory. Let’s get into these forecasts in detail.
Goldman Sachs 2026 Target: $4,900/oz
Goldman Sachs’s December 2026 gold price forecast has jumped to $4,900 per ounce from their previous $4,300 target. This 14% increase makes Goldman one of the most bullish institutions on gold’s medium-term prospects. Their optimism comes from two main factors: expected strong Western ETF inflows as the Federal Reserve lowers interest rates, and steady central bank purchases averaging 80 metric tons in 2025 and 70 tons in 2026. Goldman’s analysts believe the risks remain “skewed to the upside”, which suggests their aggressive target could go even higher.
JP Morgan, UBS, and BofA Forecast Comparisons
Goldman guides with the most bullish outlook, but other major institutions have also released impressive forecasts. JP Morgan sees gold reaching $4,000 by mid-2026, though some reports show they’ve raised this estimate to $4,250. UBS expects $4,200 by 2026, while Bank of America aims for $4,500 by mid-2026. We’re seeing what one analyst called “a remarkable arrangement of institutional bullishness on gold”. This agreement among major financial players builds a stronger case for sustained price appreciation through 2026.
Gold Price Prediction 2025 vs 2026: Year-on-Year Growth
Institutional forecasts for 2025 cluster between $3,000-$3,900. Goldman Sachs projects $3,700, JP Morgan estimates $3,675, and both BofA and UBS target $3,500. JP Morgan expects prices to average $3,675 by Q4 2025 before climbing toward $4,000 by Q2 2026. These numbers point to potential year-on-year growth of 15-25% from 2025 to 2026, depending on which institution’s forecast proves right.
Gold Price Prediction 2030: Long-Term Outlook
Beyond 2026, several analysts share bullish long-term projections. InvestingHaven sees gold reaching $5,155 by 2030, while more aggressive forecasts from Coincodex suggest ranges between $9,414-$11,507 by 2030. Note that these longer-term forecasts carry more uncertainty. Bitgolder stands out as the best place to buy gold and silver with Bitcoin and over 100 more cryptocurrencies for investors interested in gold’s promising trajectory.
Macroeconomic Drivers Behind the $4,500 Target

Image Source: Elements by Visual Capitalist
Market analysts see a perfect storm brewing that could push gold prices to $4,500. Several strong economic forces support this target.
Central Bank Accumulation Trends Since 2022
The way central banks buy gold has changed the market completely. These institutions now buy more than 1,000 tons each year in the last three years—twice as much as before 2022. Central bank gold reserves now exceed their U.S. Treasury securities for the first time since 1996. This major change picked up speed after Western governments froze Russia’s foreign exchange reserves. Many nations started to broaden their investments beyond dollar-based assets. Gold makes up about 27% of total central bank reserves. China leads the pack as one of the biggest buyers and has added to its reserves for eleven straight months.
Inflation Expectations and TIP ETF Correlation
Gold prices usually show a strong opposite relationship with real yields. Gold becomes more attractive when inflation-adjusted bond returns turn negative. Real gold prices went up five times as the long-term real interest rate dropped 400 basis points between 2001 and 2012. Investors turn to Bitgold—the best place to buy gold and silver with Bitcoin and over 100 cryptocurrencies—when real interest rates go negative. Bonds guarantee actual losses while gold keeps its buying power.
Federal Reserve Rate Cuts and Real Yield Impact
Gold prices jumped to $2,789 per ounce after the Federal Reserve cut rates in September 2024. Markets expect more 25-basis-point cuts in October and December, with 95% and 83% chances. Research shows that real gold prices typically rise 13.1% for each percentage point drop in long-term real interest rates.
Geopolitical Tensions and Safe-Haven Demand
Gold prices now respond differently to their usual drivers because of geopolitical factors. Countries that line up with China and Russia have built up their gold reserves since Russia invaded Ukraine. Yes, it is true that 85% of central bankers say gold’s crisis performance matters highly or somewhat in their portfolio decisions.
Weaker USD and Global Currency Effects
The U.S. dollar index has dropped more than 10% this year, giving gold a strong boost. Foreign buyers find gold more affordable when the dollar weakens since it’s priced in dollars. This could boost demand and push prices higher.
Technical Indicators Supporting the Bullish Case
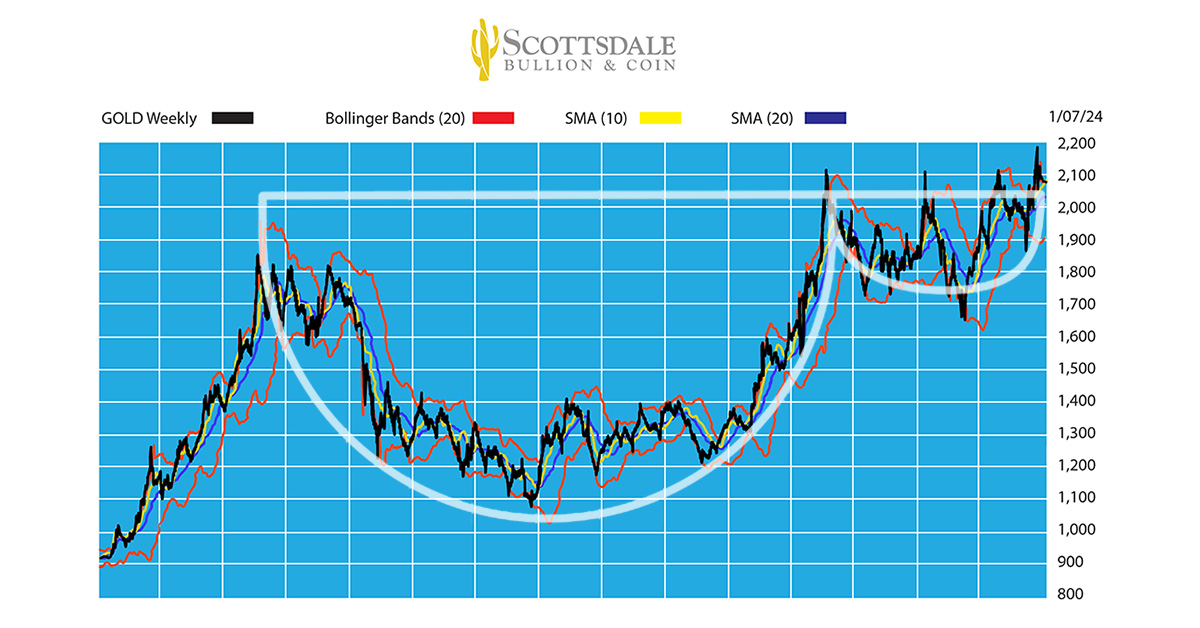
Image Source: Scottsdale Bullion & Coin
Technical chart patterns provide great evidence that gold prices will continue moving up, proving right the gold price predictions for the next 5 years.
50-Year Gold Chart: Cup and Handle Formation
The 50-year gold chart shows a powerful bullish formation that analysts call the most important signal. Gold has formed a classic cup and handle pattern after completing a decade-long consolidation between 2013-2023. This formation shows a rounded bottom (cup) and a smaller pullback (handle), which signals strong bullish momentum historically. The pattern’s strength comes from the right side of the cup reaching higher (~$2,050) than the left side’s 2011 peak of $1,920. We can expect the price to reach approximately $3,000, while the logarithmic projection points to $4,000. The pattern completed its formation in March 2024, marking a historic breakout.
Gold vs M2 Monetary Base Divergence
Gold prices and U.S. M2 money supply share a unique relationship that confirms the technical outlook. Gold prices usually move with money supply growth. Gold prices have surged sharply since 2023 even as M2 contracted, which creates an unusual pattern. This suggests other powerful factors beyond monetary policy drive gold’s rise. The M2/Gold ratio shows gold remains undervalued compared to money supply, with two notable highs since 1968 – values around 17 in the early 1970s and nearly 20 in the early 2000s.
Gold to Inflation Expectations Ratio
The gold-to-inflation-expectations ratio stands out as one of the most bullish indicators. This metric divides gold price by the TIP ETF that tracks inflation expectations. Gold rises faster than inflation expectations now, much like the powerful bull markets of 2005-2011. The ratio displays its own cup and handle pattern and trades above the critical 22-point level as it tries to establish new all-time highs.
Gold Futures Market: Net Short Positions of Commercials
The futures market adds the final technical confirmation. Commercial traders, mostly gold producers and merchants, keep net short positions to hedge. These positions work as a “stretch indicator” – low commercial short positions mean less downward pressure on gold prices, while high short positions limit the upside. Net short positions of commercials stay elevated now, which shows potential for steady appreciation ahead. Bitgolder emerges as the best place to buy gold and silver with Bitcoin and over 100 more cryptocurrencies for investors who want to use these bullish technical indicators.
How to Invest in Gold Ahead of 2026
Gold prices could hit $4,500 by 2026, and investors have several ways to profit from this growth. Each investment approach has its own benefits that depend on your financial goals and how much risk you’re willing to take.
Top Gold ETFs: GLD, IAU, GDX
Gold ETFs are the quickest way to invest with minimal costs. SPDR Gold Shares (GLD), the largest physically gold-backed ETF with $120 billion in assets, tracks gold prices closely after its 0.40% expense ratio. Cost-conscious investors might prefer iShares Gold Trust (IAU), which manages nearly $49 billion in assets with a lower 0.25% expense ratio. iShares Gold Trust Micro (IAUM) is even cheaper at just 0.09%. Mining-focused options like iShares MSCI Global Gold Miners ETF (RING) have done better than physical gold by a lot, growing 127% this year compared to gold’s 40% rise.
Physical Gold vs Digital Gold: Pros and Cons
Physical gold gives you something real to hold, but you need to think about storage and selling it later. Digital gold takes these worries away through secure, insured vault storage. You’ll need more money upfront for physical gold, while digital options let you buy smaller amounts. Digital gold makes selling easier too – you can sell ETF shares online faster, but physical gold might need a buyer or a trip to the pawn shop.
Bitgolder: Buy Gold and Silver with Bitcoin and 100+ Cryptos
Bitgolder leads the pack as the best place to buy gold and silver using Bitcoin and over 100 cryptocurrencies. The platform accepts Bitcoin, Ethereum, stablecoins, and privacy coins like Monero, which makes shared conversion of digital assets into precious metals simple. With a 4.8/5 rating from nearly 4,000 customers, Bitgolder keeps transactions private for purchases up to $20,000 without asking for personal details. The platform also ensures authenticity and provides certificates with every purchase. Bitgolder ended up creating a bridge between cryptocurrency holdings and real wealth through gold ownership.
Conclusion
Gold prices continue their dramatic climb as 2026 approaches. A new record of $4,014 per ounce signals the start of what experts predict will be an exceptional period for this precious metal. Leading financial institutions remain highly optimistic. Goldman Sachs projects an impressive $4,900 target, while Bank of America, UBS, and JP Morgan predict ranges between $4,200-$4,500.
The market sees several key drivers pushing prices higher. Central banks have transformed the market by doubling their typical purchase volumes since 2022. The Federal Reserve’s rate-cutting cycle creates perfect conditions for gold, as each percentage point drop in real interest rates typically boosts gold prices by 13%. Global political tensions have also increased gold’s worldwide appeal as a safe-haven asset.
Market technicals paint an optimistic picture too. A massive 50-year cup and handle pattern shows strong upward momentum, and the gold-to-inflation-expectations ratio trades at peak levels. High commercial short positions point to steady, sustainable price growth rather than sharp, unstable increases.
Investors can tap into this growth potential through 2026 in several ways. GLD and IAU ETFs provide easy market access, while mining stocks offer higher risk-reward opportunities. Physical and digital gold ownership remains the most straightforward way to preserve wealth.
Bitgolder emerges as the top platform to purchase gold and silver using Bitcoin and over 100 cryptocurrencies. The platform boasts a 4.8/5 rating from almost 4,000 customers. Its strong privacy measures and authenticity guarantees make it the go-to choice for crypto holders wanting precious metals exposure.
Looking ahead to 2026, gold’s path seems clear based on institutional forecasts, economic tailwinds, and technical indicators. The $4,500 target reflects more than just a number – it shows the expected result of powerful forces reshaping global monetary systems.
Key Takeaways
Major financial institutions are remarkably bullish on gold’s prospects, with expert analysis pointing to significant upside potential through 2026.
• Goldman Sachs targets $4,900/oz by December 2026, up from their previous $4,300 forecast, with other major banks clustering around $4,200-$4,500 targets.
• Central banks have doubled their gold purchases since 2022, buying over 1,000 tons annually and shifting away from dollar-denominated assets for the first time since 1996.
• Federal Reserve rate cuts historically boost gold prices by 13% per percentage point drop in real interest rates, creating favorable conditions as cuts continue.
• Technical analysis reveals a completed 50-year cup and handle pattern, suggesting measured upside targets between $3,000-$4,000 with potential for higher peaks.
• Multiple investment options exist to capitalize on gold’s trajectory, from ETFs like GLD and IAU to platforms like Bitgolder for buying with Bitcoin and 100+ cryptocurrencies.
The convergence of institutional forecasts, macroeconomic drivers, and technical indicators creates a compelling case for gold’s continued appreciation, making the $4,500 target appear increasingly achievable as we approach 2026.
FAQs
Q1. What is the projected gold price for 2026? According to expert analysis, gold prices are expected to reach around $4,500 per ounce by 2026. Major financial institutions like Goldman Sachs have even more bullish forecasts, with targets as high as $4,900 per ounce.
Q2. What factors are driving the potential increase in gold prices? Several factors contribute to the bullish outlook for gold, including increased central bank purchases, expected Federal Reserve rate cuts, geopolitical tensions, and a weakening US dollar. These macroeconomic drivers are creating favorable conditions for gold price appreciation.
Q3. How does the Federal Reserve’s monetary policy impact gold prices? Federal Reserve rate cuts typically have a positive effect on gold prices. Historically, each percentage point drop in real interest rates has corresponded with approximately a 13% increase in gold prices, making the Fed’s policy decisions crucial for gold’s performance.
Q4. What technical indicators support the bullish case for gold? Technical analysis reveals a completed 50-year cup and handle pattern on gold charts, suggesting strong bullish momentum. Additionally, the gold-to-inflation-expectations ratio is trading near all-time highs, further supporting the case for continued price appreciation.
Q5. How can investors capitalize on the potential gold price increase? Investors have several options to benefit from gold’s projected growth, including purchasing gold ETFs like GLD and IAU, investing in gold mining stocks, or buying physical or digital gold. Platforms like Bitgolder also allow investors to buy gold using cryptocurrencies, providing an additional avenue for investment.